Posts filed under ‘Evaluation reporting’
Using graphs and diagrams to explain
I recently had a discussion with a colleague about how we should represent the findings of an evaluation study. I am a big fan of using graphs and diagrams to explain the findings – as they say a “picture tells a thousand words”.
But we often see many misuses of graphs and diagrams that can provide an incorrect idea for the reader. I came across an example from a report recently which I have reproduced here:
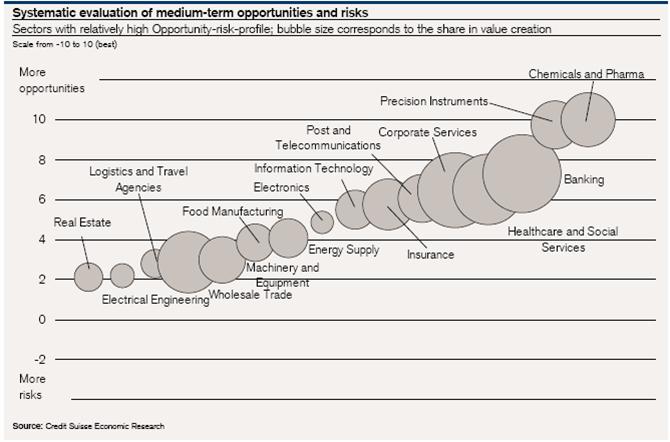
This is an interesting example of a pictogram or scatter chart to represent two variables: 1) level of opportunity/risk (vertical scale) and 2) size of share value (size of bubbles).
But examing this chart, it made me wonder – what does the horizontal scale represent? In other words, on what basis are the bubbles placed left to right? I cannot see any logical basis in the chart for the horizontal location of the bubbles. I think that’s unfortunate as such a chart could use the horizontal scale to reinforce the share value variable or distribute the bubbles on another basis (e.g. sector of interest).
For those interested in graphic presentation of information, some key texts to read are found on the website of Edward Tufte, a leading specialist in this area.
Glenn
The magical number seven, plus or minus two

In an earlier post on best practices for likert scale questions, I made reference to an article “The Magical Number Seven, Plus or Minus Two: Some Limits on Our Capacity for Processing Information”. A reader pointed out to me that this is one the most famous social psychology articles (by George A. Miller, 1956).
A main conclusion of the article is that most people can only deal with seven ideas at a time. Very clever people can manage up to nine and less skilled people may only be able to concentrate on five ideas at once.
Putting this theory into practice, I can see plenty of examples which call out for the “seven point limit”, such as:
- Number of chapters in a report
- Number of recommendations in reports (if there are more than seven then they should be broken down under sub-headings)
- Number of points on a likert scale question (see my previous post on this)
- Lists of variables/aspects that must be ranked/rated on surveys (e.g. “please rate the following aspects of the website..”)
- Items on a checklist to be assessed (see my previous post on checklists)
And that’s only five ideas so us less skilled people can cope…
Glenn
Six factor to ensure that your evaluation results are used

As I wrote in a previous post, evaluation can be quite frustrating when all your effort and work doesn’t actually lead to any significant change in future practices. Why are evaluations not used? A new report “The Utilisation of Evaluations” (pdf) from ALNAP throws some light on this subject. Although focusing on the humanitarian sector, the report has some points that apply to all types of evaluations. I found interesting the six quality factors the author identifies that contribute to the findings of an evaluation being utilised, notably:
- Designing carefully the purpose and approach of the evaluation
- Managing quality participation of all stakeholders throughout the evaluation
- Allowing enough time to have all relevant staff and stakeholders involved
- Ensuring that the evidence is credible and the report is easy to read with clear, precise recommendations with who is responsible for what and when
- Putting in place follow-up plans at the outset
- Ensuring that the evaluator(s) are credible, balanced and constructive – wholesale negativity is never welcomed
Going through these six factors I can see where I’ve faced obstacles in past evaluations, notably points 2 and 5. I find managing stakeholder involvement is often difficult and so is setting out follow-up plans – it often comes as an after-thought. Certainly some factor to consider for all evaluators…
Read the full report (pdf) here >>
Glenn
Presenting monitoring & evaluation results

The more I work in the M&E field, the more I see the importance of presenting results in a consumable way. If you are leading an evaluation project, there is nothing more frustrating than finishing your project and finding the comprehensive report you wrote gathering dust on a manager’s desk.
But that’s what I have learnt, the comprehensive report will perhaps only be read by one or two people of the commissioning team – but the powerpoint summarising the report will be widely distributed and viewed by many. We may think this is a “dumbing-down” of the work undertaken but it is a reality of how our work is consumed. Here are some points on presenting results that I find useful:
- Think carefully about the data and findings you want to present. We can often be overwhelmed by data (from survey results for example). If in doubt, put data you consider important but not essential in report annexes.
- Make the evaluation report attractive and easy to ready – facilitate this by summarising the main points and creating a brief presentation.
- Organise an event such as a staff or team meeting to discuss the results – this could have more impact than the written document.
- Through blogs and wikis, use the evaluation results to generate more discussion and interest in the given subject. A good example is the blog created to present the results of the 2006 Euroblog survey.
Jim Macnamara in a recent article (pdf) touches on this subject on how presenting results with a “two-tier” approach is useful – that is, presenting to top management only key data and information while fully digesting all data at the corporate communications level.
Glenn
Cartoon from toothpaste for dinner>>
Client Perspective of Evaluation
The Active Learning Network for Accountability and Performance in Humanitarian Action (ALNAP), has recently published the results (pdf) of a survey of evaluation managers from humanitarian organisations.
ALNAP had responses from 46 evaluation managers that commission and manage evaluation projects for humanitarian organisations. This provides an interesting insight into the “client” perspective of evaluation, some highlights:
What helps promote an evaluation?
ownership or “buy in” of an evaluation was the most often stated promoting factor. Quality of the evaluation report and recommendations was also important.
What inhibits the use of an evaluation?
The most frequently mentioned factor was the imposing of and evaluation by HQ and/or donor. The arrogant, fault-finding or ivory tower approach of evaluators and insufficient time for the evaluation leading to superficial results were also important factors.
What other factors induce changes in an organisation?
A very interesting question – what factors do they believe impact on change – apart from evaluation. Respondents mentioned two important influences: the media and donors. And to a lesser extent, the influence of peers (exchange/discussions between agencies)
Why do organisations evaluate?
Formal accountability (obligation to donors, trustees, etc.)
Improving the programme
Learning for the organisation
Legitimising (to add credence or challenge existing agenda)
how to increase use of evaluation?
Most respondents mentioned changing the atttitude of senior manager and the culture of learning within their organisations. Respondents spoke of a culture of defensiveness rather than of learning and reflection.
Some very interesting results. It also confirms what I have seen in the humanitarian field: communications professionals are slowly coming around to recognise that evaluation is necessary and important – but this is being prompted by pressure from donors and the monitoring and evaluation units that are sprouting up in their organisations.
Glenn
