10 evaluation infographics
Infographics are visual images used to represent information and/or data. Increasingly we see infographics used to communicate key evaluation findings. It can be an excellent tool to communication key findings quickly and to reach diverse audiences. The presentation below contains 10 evaluation infographic that I’ve collated from various evaluations. I think these examples show the different possibilities and options for how you can use this tool to communicate key findings.
(disclaimer – I’ve been involved in one of the evaluations featured – that done by Oxfam)
5 resources on communicating evaluation results
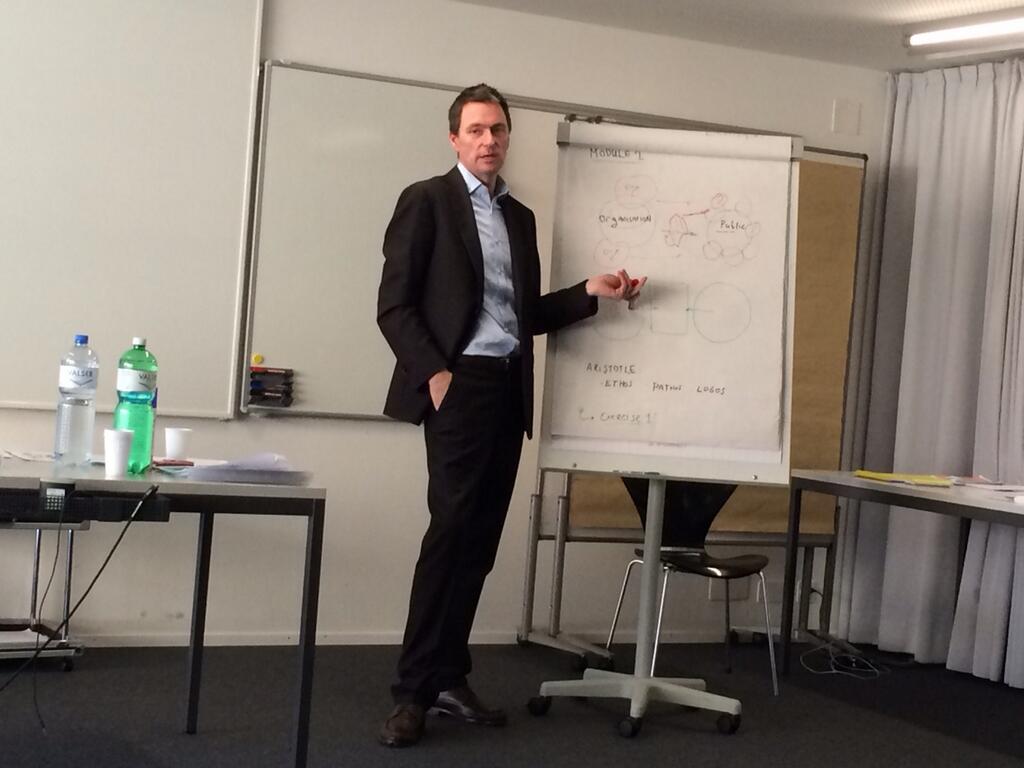
I had the pleasure last week to run a workshop for 2 days in Berne, Switzerland on the theme Integrating Communication in Evaluation organised by the Swiss Evaluation Society and LAUCO Training and Evaluation. In my research for the workshop, I discovered some new resources on communicating evaluation results, here are a selection:
4. Communicating and Reporting on an Evaluation – from the American Red Cross & CRS (2008), (pdf) >>
5. Tips for delivering negative results (blog post – J. Sinclair), 2013 >>
This photo from Patricia Goldschmid of myself explaining some points at the workshop – thanks again for all the participants for making it such an enjoyable experience!
Glenn
Insights into global advocacy: Oxfam’s GROW campaign
I recently spoke at the Graduate Institute in Geneva for the students of the Certificate in Advocacy in International Affairs – presenting a case study on Oxfam’s GROW campaign – drawing insights on global advocacy campaigns. My presentation is below:
Advocacy and Policy Influencing Blended Learning programme – March to April 2014
Here is an interesting course from INTRAC on advocacy influence – online blended learning that can be taken from anywhere in the world:
“Is developing and implementing an advocacy strategy critical to success in your project or programme? Do your staff and partners need support to achieve your advocacy objectives? In this capacity building programme, you will have the opportunity to develop and troubleshoot the implementation of an advocacy strategy as well as build your knowledge and confidence.
This programme will give you the knowledge and skills to influence policy and practice in your own context. You will learn skills to help you plan and deliver an effective advocacy strategy; enhance your ability to lobby decision makers; and gain confidence in the ways in which you relate to different audiences. You will also have the skills to analyse power dynamics and choose your advocacy activities so they have maximum impact.”
Evaluation report – Oxfam’s GROW campaign
For readers interested in campaign evaluation, Oxfam has just published a mid-point external evaluation report (pdf) of their GROW campaign – of which I was part of the evaluation team.
Often organisations will not make available publically their campaign evaluations – but Oxfam has a progressive policy on this so I’m happy to be able to share the report will all interested…
The GROW campaign set out in 2011 to tackle food justice and build a better food system. Challenging to evaluate, the GROW campaign is broad and diverse, operating at national, regional and international levels, across 4 thematic areas – land, investment in small-scale agriculture, climate change and food price volatility.
In our evaluation report we look at the initial Theory of Change and endeavour to track the changes seen over the first two years and the possible intervening factors, positive and negative, using a variety of methods including five case studies (found at the end of the report).
As the campaign had a broad set of activities at a range of levels, the challenge for the evaluation team was to capture all significant changes seen to date and draw out learnings for the future.
Oxfam has also produced a summary infographic that you can view below.
View the executive summary (pdf)>>
The executive summary is also available in French (pdf) and Spanish (pdf) – and you can also read Oxfam’s management response to the evaluation (pdf).

Training course on advocacy evaluation, London UK
Here is an interesting two day training course on advocacy evaluation taking place in London in May, September & November 2014:
“Over two days this new course takes participants on a journey through the advocacy evaluation landscape. The course begins by highlighting the unique challenges faced in advocacy evaluation, supporting participants to understand which approaches, methods and tools will work best for their contexts and in assessing the impact of their work. Participants will be given a useful monitoring and evaluation framework to help design their evaluation plans, and through group work, have the opportunity to experiment with a range of unique advocacy data collection tools”
Workshop on evaluation and complexity – Berne, June 5-6 – registration open
Registration is now open for the workshop on Evaluating Complex Interventions in Complex Environments – June 5 to 6, 2014.
The workshop will be run by Professor Patricia Rogers and will take place in Berne at the Federal Office of Personnel, Eigerstrasse 71.
Fees for the 2-day workshop are CHF650.00 for SEVAL members and CHF700.00 for non members, exclusive of travel and meals. Registration is now open online at:
Likert scale – left or right?
I’ve written previously about the Likert scale and using it in surveys. On one point, I discussed whether the response options should be displayed positive to negative or negative to positive – the image below is negative (‘strongly disagree’) to positive (‘strongly agree’).

I’ve recently come across two articles (listed below) where they have researched this issue – and they have found that the place of the response option does matter. In summary, they found that the items placed on the left hand side gets more people selecting them than those on the right. They also found that when using vertical lists, the first items are more selected than others further down the list.
So what is the solution? One option I see is that many survey software offer the possibility when creating questions for the response options to be “flipped” – that is, some people will see them negative to positive and others will see them positive to negative. It also makes sense to vary the response order in long surveys, particularly when using same or similar scales – to avoid respondents suffering from “survey fatigue”.
The relevant articles:
Response order effects in Likert-type Scales (pdf) >>
The biasing effect of scale-checking styles on response to a Likert Scale (pdf)>>
Evaluators who blog
The American Evaluation Association’s Tip-a-Day Blog AEA365 recently published a series of blog posts from evaluators who blog – I’m happy to report that I participated – you can view my post here>>.
Advocacy M&E: examples from Global Witness, Save, Amnesty and CDKN
Below are some useful examples – presentation posters – of how leading NGOs are tackling advocacy monitoring and evaluation:
Developing a Planning, Monitoring, Evaluation and Learning (PMEL) System for Global Witness. Jenny Ross (Consultant and INTRAC Associate) and Gavin Hayman (Global Witness)
http://www.intrac.org/data/files/NGO_Forum_2013/Jenny_Ross_Global_Witness_-_final.pdf
Tracking advocacy efforts: Save the Children’s Advocacy MonitoringTool. Save the Children
http://www.intrac.org/data/files/NGO_Forum_2013/Save_the_Children_-_final.pdf
Supporting international climate negotiators: a monitoring and evaluation framework. Climate and Development Knowledge Network (CDKN)
http://www.intrac.org/data/files/Afternoon/CDKN_-_final.pdf
Using ‘theory of change’ approach to assess human rights advocacy. Amnesty International
http://www.intrac.org/data/files/Afternoon/3Amnesty_International_-_final.pdf
These posters are from an INTRAC training workshop – thanks to Jenny Ross for highlighting them.
