Posts tagged ‘evaluation use’
New article: Pathways to use of campaigns’ evaluation findings
I’m very happy to share with you an article I co-authored – for those interested in campaigning, evaluation and evaluation use:
Highlights
- A categorization of six pathways to evaluation use is proposed.
- Evaluation use occurred slightly more non-linear than linear.
- Evaluation use was mostly unexpected.
- Overall meaning assigned to evaluation was linked to frequency of evaluation occurring.
- Evaluation use contributing to change was often indirect and not simple.
Abstract
This article presents a study on the pathways and processes regarding the use of evaluation findings of communication campaigns from two international organizations, the Office of the High Commissioner for Human Rights (OHCHR) and the International Committee of the Red Cross (ICRC). Several years after the completion of the campaigns and their evaluations, our research identified 28 instances of use and six instances of non-use of the evaluation results, of which the large majority being surprising in nature. Results showed that evaluation use facilitated formal and informal changes at the individual and the organizational level; and, this pattern occurred in a predominantly non-linear fashion, interconnected and overlapping, while gradually decreasing in time and space. Evaluation use was mostly unpredictable, which reflected how meanings are constructed by staff members, as they adjusted and interpreted the findings in opportunistic ways.
New report: Evaluation Capacity and Practice in the US Nonprofit Sector
A very interesting report is just out from the Innovation Network on the Evaluation Capacity and Practice in the US Nonprofit Sector (pdf).
Here are some excerpts on resources and evaluation:
- 99% of organisations have someone responsible for evaluation
- 84% of organisations spend less than 5% on evaluation
- 16% spend zero on evaluation (!)
There are also more interesting findings on evaluation use and barriers/supporting factors for evaluation – view the report here (pdf)>>
Tracking Use of Campaign Evaluation Findings
This week I made a presentation at the European Evaluation Society conference on a tracking study on the use of campaign evaluation (that I had carried out). For those interested in this subject, my slides are here for your consumption!
Visual summaries of evaluation reports
In commu nicating evaluation findings, challenges are often seen with the key product to do so – the evaluation report. Often evaluation reports suffer from being long, wordy and just plain boring! Therefore, we have to find new ways to communication evaluation findings.
One way I find interesting is the use of a visual summary of findings – that summarises the evaluation findings graphically and in a limited number of pages. I recently had the opportunity to use this format for an evaluation for Oxfam – as seen in the image in this post. You can view the full summary by clicking on the image (it brings you to a pdf file).
Evaluation reporting: A guide
From the US CDC, here is an interesting guide: Evaluation reporting: A guide to help ensure use of evaluation findings (pdf).
It contains many tips and advice on how to craft your evaluation report to make it more *usable*…
Presenting evaluation findings – Using Prezi
I’ve written before about the challenges of presenting evaluation findings – and the need to find creative ways to present findings. No doubt many readers would have already come across Prezi, a new presentation software that you see used often these days. I’ve recently worked on a research project for the Joint Standards Initiative where we presented our research results in a Prezi as you can see displayed below. It is allows the results to presented in visually appealing way and I believe communicates well the main points.
This Prezi was produced by Peter from YourPrezi.
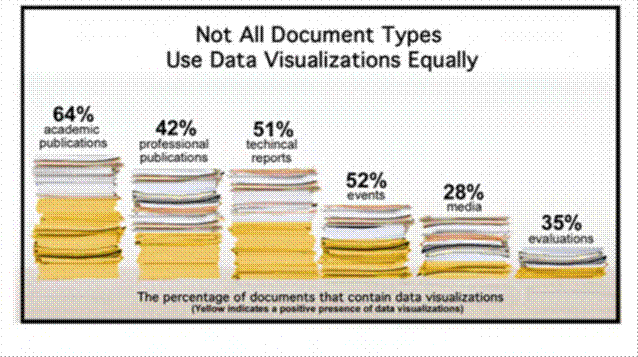
Data visualization for evaluation
If you are interested in how evaluation results are presented as I am, then you might be interested in this fact sheet (pdf) from IDRC on data visualization for communicating research and evaluation findings. It contains some fascinating information on how data visualization can be used (and misused). As can be seen in the chart below it shows that evaluation reports are on the low end in terms of their usage of data visualization.
Seven new ways to present evaluation findings
As regular readers will know, I am very interested in how findings of evaluations are presented and used, as I’ve written about before. I’ve put together a brief presentation on this subject (see below) entitled “Seven new ways to present evaluation findings” that I’m presenting today at the European Evaluation Society Conference in Helsinki, Finland. Comments and other ideas welcome!
