Event scorecard
May 11, 2008 at 10:55 am 7 comments
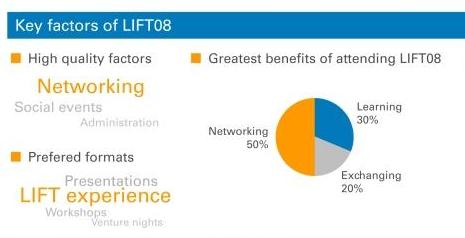
In the work I do to evaluate conferences and events, I have put together what I believe is a “neat” way of displaying the main results of an evaluation: an event scorecard. In the evaluation of a conference that occurs every year in Geneva, Switzerland, the LIFT conference, the scorecard summarises both qualitative and quantitative results taken from the survey of attendees. Above you can see a snapshot of the scorecard.
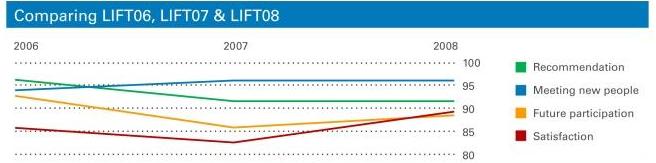
As I have evaluated the conference for three years now, we were also able to show some comparative data as you can see here:
If you are interested, you can view the full scorecard by clicking on the thumbnail image below:

And for the really keen, you can read the full evaluation report of the LIFT08 evaluation report (pdf).
Greetings from Tashkent, Uzbekistan from where I write this post. I’m here for an evaluation project and off to Bishkek, Kyrgyzstan now.
Glenn
Entry filed under: Conference / event evaluation, Evaluation tools (surveys, interviews..), PR evaluation, Training evaluation. Tags: Conference / event evaluation.
7 Comments Add your own
Leave a comment
Trackback this post | Subscribe to the comments via RSS Feed

1. Richard Gaunt | May 14, 2008 at 8:27 am
Glenn, you do seem to move around! We look forward to your next report.
2. Glenn | May 16, 2008 at 7:36 am
Thanks Richard, back in Tashkent now but leaving for Geneva.
Cheers
Glenn
3. Anna Miotk » Archiwum bloga » Pomiar efektów konferencji | May 20, 2008 at 10:30 am
[…] blogu intelligent measurement pojawiła się notka o tym, jak można zmierzyć efekty po organizacji konferencji branżowej na przykładzie cyklicznej konferencji LIFT08. Ocena została przeprowadzona na podstawie ankiety […]
4. Propitiate | June 19, 2008 at 5:56 am
Somehow i missed the point. Probably lost in translation 🙂 Anyway … nice blog to visit.
cheers, Propitiate.
5. evaluating events and conferences « intelligent measurement | September 24, 2008 at 1:19 pm
[…] done some event evaluation projects in the past years and have developed an “event scorecard”. To summarise and share my experiences, I have just created a fact sheet “Evaluating events […]
6. Blog on event evaluation « intelligent measurement | October 2, 2008 at 7:46 am
[…] to what I do with an “event scorecard”, here is an interesting post with visuals on how to represent event evaluation – the ROI measures […]
7. Wuling.id | September 5, 2018 at 7:41 am
wuling.id
Event scorecard | intelligent measurement