Posts filed under ‘Evaluation reporting’
10 evaluation infographics
Infographics are visual images used to represent information and/or data. Increasingly we see infographics used to communicate key evaluation findings. It can be an excellent tool to communication key findings quickly and to reach diverse audiences. The presentation below contains 10 evaluation infographic that I’ve collated from various evaluations. I think these examples show the different possibilities and options for how you can use this tool to communicate key findings.
(disclaimer – I’ve been involved in one of the evaluations featured – that done by Oxfam)
5 resources on communicating evaluation results
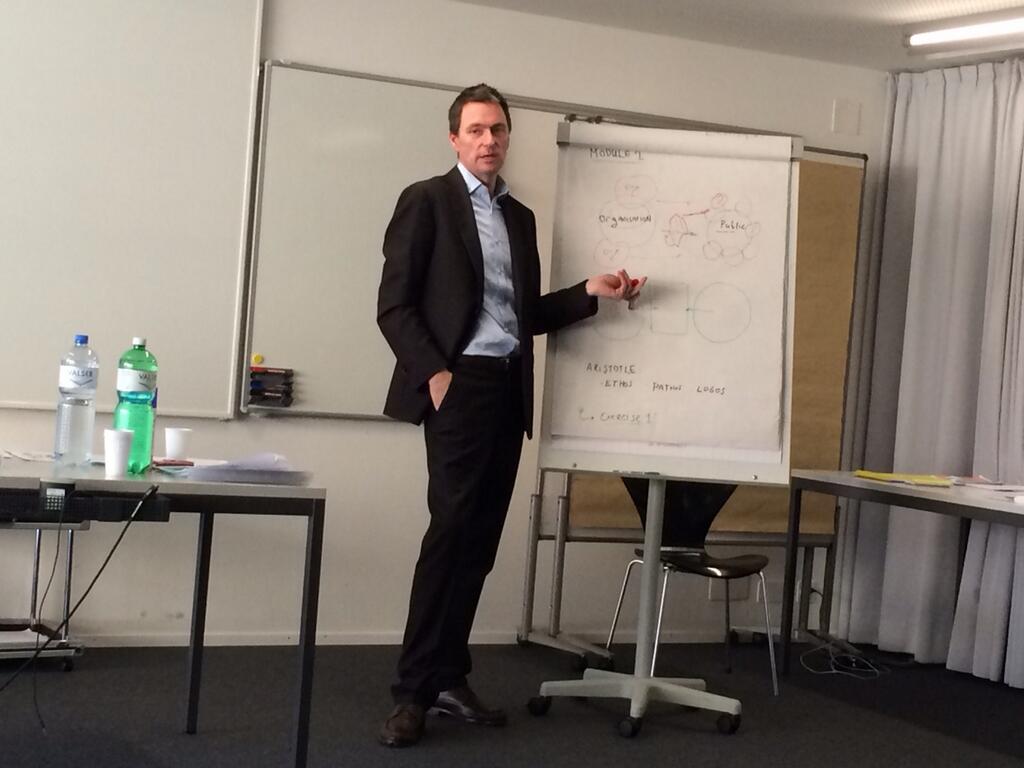
I had the pleasure last week to run a workshop for 2 days in Berne, Switzerland on the theme Integrating Communication in Evaluation organised by the Swiss Evaluation Society and LAUCO Training and Evaluation. In my research for the workshop, I discovered some new resources on communicating evaluation results, here are a selection:
4. Communicating and Reporting on an Evaluation – from the American Red Cross & CRS (2008), (pdf) >>
5. Tips for delivering negative results (blog post – J. Sinclair), 2013 >>
This photo from Patricia Goldschmid of myself explaining some points at the workshop – thanks again for all the participants for making it such an enjoyable experience!
Glenn
Data visualization – tips for evaluation reports
For those who use graphs in evaluation reports and other documents, here is an excellent presentation from Ann K. Emery of the Innovation Network – well worth a look!
Two evaluation workshops in Switzerland – 2014
An often-overlooked step in evaluation is ensuring that findings are communicated, understood and acted upon. Equally important, however,is what, how and when we communicate with different stakeholders throughout the evaluation process. Communicating effectively implies using different means,messages and methods to reach different groups with very different needs and expectations.
2) Addressing complexity in evaluation – June 5 and 6, 2014
Increasingly evaluations have to address programs, projects and policies with complex aspects. The activities and objectives of these interventions are fundamentally dynamic and emergent in response to needs and opportunities, and they often involve multiple organisations with emergent and unpredictable roles. These characteristics present challenges to traditional evaluation approaches.
The workshop will examine the particular challenges that complexity presents and explore practical strategies for evaluation, including developmental evaluation, use of non-linear logic models, and emergent evaluation design. The workshop will include case studies of successful and unsuccessful attempts to address complexity in evaluation. It will also provide opportunities to analyse participants’ own examples in terms of identifying the particular challenges that complexity presents and how the different strategies might be applied.
The workshop will be facilitated by Professor Patricia Rogers, Royal Melbourne Institute of Technology, Australia.
Both courses will will be held in the Federal Office of Personnel, Bern, Switzerland. Please note that there are no scholarships or travel funds available for these courses.
Evaluation reporting: A guide
From the US CDC, here is an interesting guide: Evaluation reporting: A guide to help ensure use of evaluation findings (pdf).
It contains many tips and advice on how to craft your evaluation report to make it more *usable*…
video reporting: realtime evaluation
 I’ve blogged before about the use of video in presenting evaluation findings. Here is a good example of how video has been used to present the process and some key results of a real-time evaluation of the 2010 floods in Pakistan. The video tells the story well even if it is missing some background information for the viewer (what, why and for whom was the evaluation).
Presenting evaluation findings – Using Prezi
I’ve written before about the challenges of presenting evaluation findings – and the need to find creative ways to present findings. No doubt many readers would have already come across Prezi, a new presentation software that you see used often these days. I’ve recently worked on a research project for the Joint Standards Initiative where we presented our research results in a Prezi as you can see displayed below. It is allows the results to presented in visually appealing way and I believe communicates well the main points.
This Prezi was produced by Peter from YourPrezi.
Data visualization for evaluation
If you are interested in how evaluation results are presented as I am, then you might be interested in this fact sheet (pdf) from IDRC on data visualization for communicating research and evaluation findings. It contains some fascinating information on how data visualization can be used (and misused). As can be seen in the chart below it shows that evaluation reports are on the low end in terms of their usage of data visualization.
10 tips for delivering negative evaluation results
 From the Better Evaluation Blog, a very useful post on how to deliver negative evaluation results – that they have summarised in ten tips:
1. Use a participatory approach from the start
2. Discuss possible negative results in the early contracting and design stages
3. Inform clients immediately and often – a ‘no surprises’ approach
4. Build in time for course correction
5. Question the evaluation plan
6. Emphasize the positives
7. Tell the truth
8. Present results in terms of lessons learned
9. Provide suggestions for addressing deficiencies
10. Involve stakeholders in identifying obstacles and ways to overcome them
Communicating Evaluation Findings: Advice from the Field
An interesting post on the Learning Portal for Design, Monitoring and Evaluation for Peacebuilding that focuses on communicating evaluation findings and brings forward three tips for those who hope to influence decisions with evaluation data:
- Answer the right questions;
- Speak their language;
- Be humble.
