Posts filed under ‘Evaluation tools (surveys, interviews..)’
Granularity – part 2 – still no one cares!
It seems that people creating surveys don’t always pay attention to granularity issues as I’ve written about before… Here is another example from a survey from people who should know better (The Guardian newspaper nonetheless)…

Now what’s wrong with this? It’s highly unusual to place an MBA at the same level as a PhD – An MBA is the same educational level as an MA or MSc – a masters degree. This would make analysis difficult afterwards as you cannot separate correctly the different levels of education – and that’s a granularity issues – placing items in a correct level – not to mention that the scale above gives the impression that an MBA has the same value as a PhD…
Glenn
Content analysis and word clouds
Content analysis is a research method to analyse and categorise all sorts of texts and images (from photos to interview transcripts to newspaper articles) with the aim of identifying trends and patterns.
This is usually a labour-intensive task but has recently been improved by smart software that appears to be getting better and better. Here is one, that I came across, Wordle, that searches through a text and gives more prominence to words appearing more frequently – and creates a “word cloud”. A simple idea that graphically can be quite revealing – here is a wordle of this very blog you are reading (click on it to see a larger version):

It’s quite interesting to see the main words that emerge; “communications”, “audience”, “survey”, “analysis” and “materials” – which for the most – are accurate descriptions of the focus of the blog.
Try creating your own word cloud on wordle>>
I discovered wordle while on the many eyes website, an interesting website about visualisation.
Glenn
Survey responses – do the “don’t know” really know?

I’ve written before about survey respones and the use of “don’t know” as an option on a Likert scale. What I said was that in some situations, a person may not have an opinion on a subject – and cannot say if they agree or disagree – so it may be wise to include a “don’t know” option. Well, i just read an interesting article that suggests that people who respond “don’t know” may actually have an opinion – it’s just that they may require a longer amount of time to develop confidence or awareness of their choice. The article gives an example of how the opinion of undecided people can be acurately predicted by creative means:
In a recent study, 33 residents of an Italian town initially told interviewers that they were undecided about their attitude toward a controversial expansion of a nearby American military base. But researchers found that those people’s opinions could be predicted by measuring how quickly they made automatic associations between photographs of the military base with positive or negative words.
Writing better survey questions

I’ve written previously about resources for putting together surveys and I’m often asked about the “wrongs and rights” of writing questions for surveys.
So I’ve put together a factsheet (pdf) that has 12 hints on writing better survey questions using real examples – both good and bad.
View factsheet on writing better survey questions (pdf) >>
Glenn
What is a survey?
Just came across the “what is survey?” website which is a very complete guide to surveys from the US National Opinion Research Centre. The guide is also available in pdf (pdf version here).
In an earlier post, I also listed other useful guides about surveys.
Glenn
![]()
From broad goals to specific indicators
 No doubt you have heard of the Millenium Development Goals (MDGs), eight broad goals on poverty, ill-health, etc, agreed upon by all countries to try and reach by 2015.
From a monitoring and evaluation point-of-view, what is interesting is that these goals are broad sweeping statements, such as:
Goal 1: Eradicate Extreme Hunger and Poverty
Goal 3: Promote Gender Equality and Empower Women
One could ask – how can these broad goals be possibly monitored and evaluated?
As detailed on this MDGs monitoring website, what has been done is to set specific indicators for each goal, for example:
Goal 3: Promote Gender Equality and Empower Women
Description: Eliminate gender disparity in primary and secondary education, preferably by 2005, and in all levels of education no later than 2015
Indicators:
3.1 Ratios of girls to boys in primary, secondary and tertiary education
3.2 Share of women in wage employment in the non-agricultural sector
3.3 Proportion of seats held by women in national parliament
So from broad goals, the MDGs focus on two to seven specific indicators per goal that they are monitoring. That’s an interesting approach, as often we see broad goals set by organisations and then no attempt made to actually detail any indicators.
the MDGs monitoring website plays an active role in monitoring these indicators combining quantitative data (statistics) and qualitative data (case studies) – also an interesting approach to show how such indicators can be tracked.
Glenn
Resources for writing surveys

Following are some useful resources for writing surveys:
A brief guide to questionnaire development (pdf) – very good guide with some interesting points on types of questions to use.
A guide to good survey design (pdf): Very comprehensive guide including “pitfalls with questions” (go to page 59).
Online survey design guide: a whole website dedicated to writing better online surveys.
20 tips for writing better surveys – good tips on managing surveys and improving response rates.
And don’t forget my own Ten tips for better web surveys (pdf), Seven tips for better email invitations for surveys, Writing open ended questions and Analyzing open ended questions.
Glenn
Social network analysis and evaluation
 Measuring networks can have many applications: how influence works, how change happens within a community, how people meet, etc. I’m interested in measuring networks as indicator of how contacts are established amongst people, particularly in events and conferences, as I’ve written about previously.
In this area, there is a new resource page available on social network analysis and evaluation from M&E news. The page contains many useful resources and examples of network analysis and evaluation for non-profit organisations, education, events and research and development – including one from myself.
(Above image is from a network analysis of a conference, further information is available here>> )
Glenn
network mapping tool

As regular readers will now, I am interested in network mapping and have undertaken some projects where I have used network mapping to assess networks that have emerged as a result of conferences.
Here is quite an interesting tool, Net-Map, an interview-based mapping tool. The creators of this tool state that it is a “tool that helps people understand, visualize, discuss, and improve situations in which many different actors influence outcomes”.
Read further about the tool and view many of the illustrative images here>>
Glenn
Event scorecard
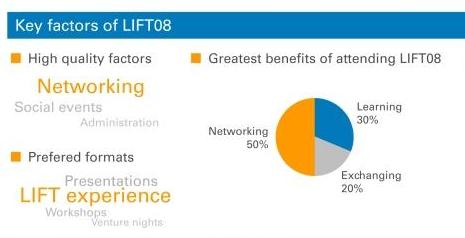
In the work I do to evaluate conferences and events, I have put together what I believe is a “neat” way of displaying the main results of an evaluation: an event scorecard. In the evaluation of a conference that occurs every year in Geneva, Switzerland, the LIFT conference, the scorecard summarises both qualitative and quantitative results taken from the survey of attendees. Above you can see a snapshot of the scorecard.
As I have evaluated the conference for three years now, we were also able to show some comparative data as you can see here:
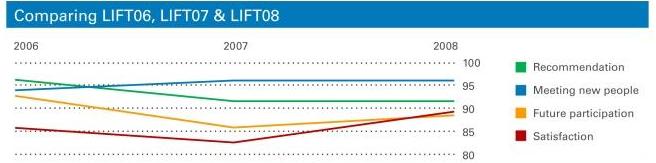
If you are interested, you can view the full scorecard by clicking on the thumbnail image below:

And for the really keen, you can read the full evaluation report of the LIFT08 evaluation report (pdf).
Greetings from Tashkent, Uzbekistan from where I write this post. I’m here for an evaluation project and off to Bishkek, Kyrgyzstan now.
Glenn
